
Prometheus Integration Guide
Prometheus is a system monitoring application that implements a highly dimensional data model. TaskCall's Prometheus integration allows alerts raised by the platform to be effectively dispatched to the correct on-call responders. The integration leverages Prometheus's AlertManager plugin. The alerts can be configured as desired with minor changes to the configuration files.
Pointers
- The integration happens between a TaskCall service and Prometheus.
- Incidents will automatically resolve in TaskCall when metrics fall back within the normal threshold.
- At the moment this integration only supports alerts to be received from Prometheus to TaskCall.
In TaskCall
- Go to Configurations > Integrations and click New Integration.
- Select the Prometheus integration.
- Give the integration a name and configure how incidents will be created. Only the Default Service field is required. The rest are optional.
- Incidents (Optional)
- TaskCall automatically maps incoming payloads with internal attributes to create incidents. However, this can be customized in the Incidents tab. Constant values can be included alongside placeholders to dictate which attributes should map to the Incident Title, Description, Tags, Snapshots and Vendor URL. To insert a placeholder use double curly braces.
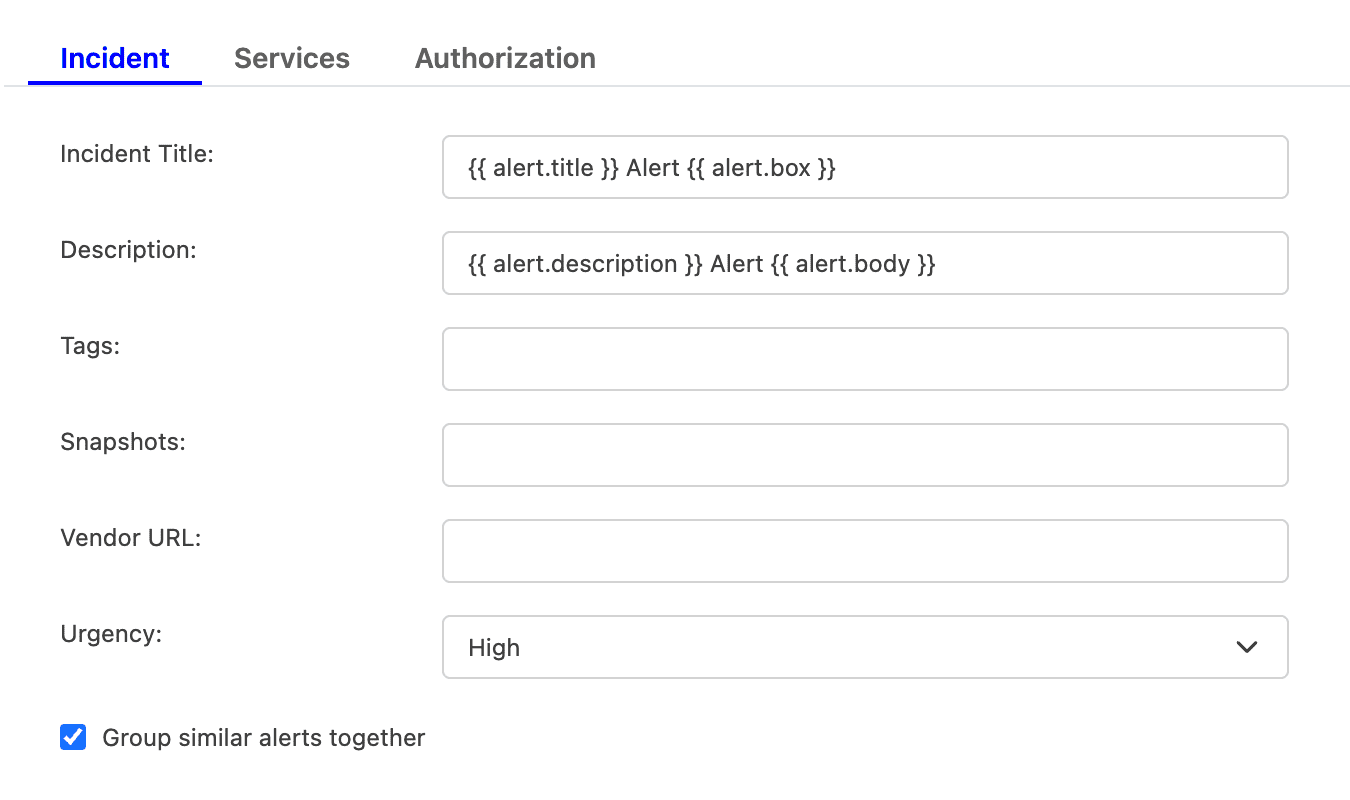
For example, if you enter {{ alert.title }} in the Incident Title field, TaskCall will look for an attribute called "title" nested inside another attribute called "alert" in the incoming payload. If the nested attribute exists, its corresponding value will be pulled from the payload and inserted. If the nested attribute does not resolve successfully, TaskCall will fall back to the default mapping.
If you are unsure, please leave the fields empty. TaskCall will use the default mapping to create the incident for you. - Select the Urgency level the incident should be created at.
- Select the option to Group similar alerts together if you would like follow up triggers from the same alert source to be grouped into the same incident. If you leave this option unchecked, then a new incident will be created for every trigger. (This behavior is specific to new triggers; not updates to an alert.)
- Click Next to move on to the Services tab.
- TaskCall automatically maps incoming payloads with internal attributes to create incidents. However, this can be customized in the Incidents tab. Constant values can be included alongside placeholders to dictate which attributes should map to the Incident Title, Description, Tags, Snapshots and Vendor URL. To insert a placeholder use double curly braces.
- Services (Required)
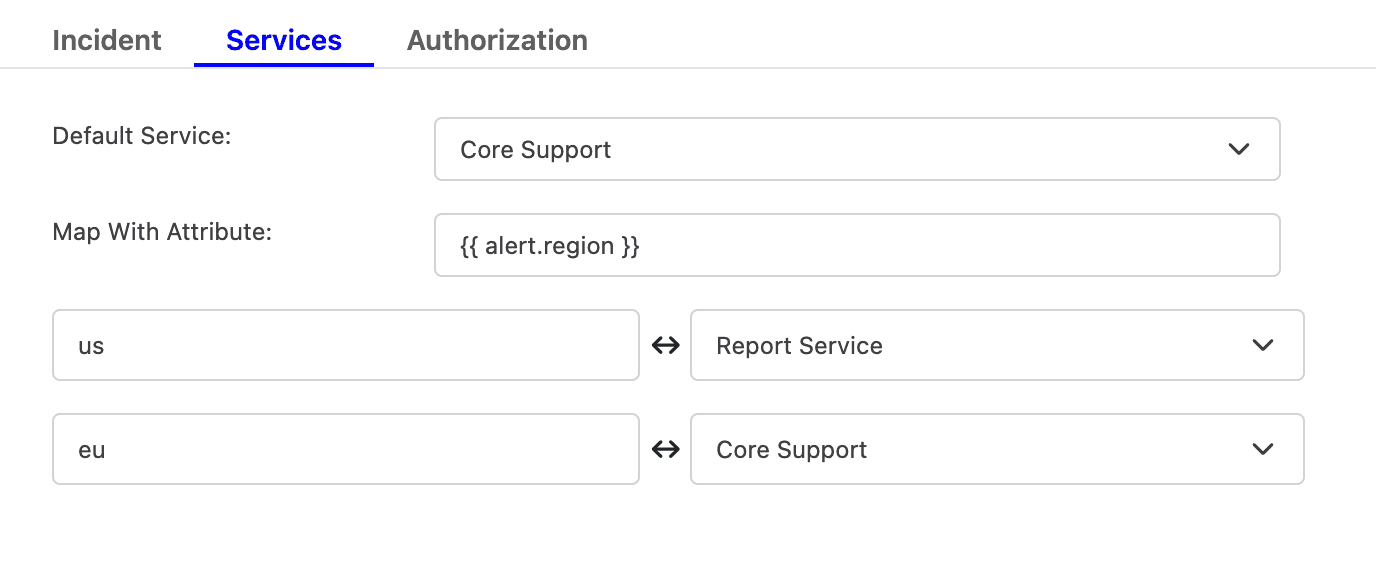
- Select the Default Service incidents should be sent to. To route incidents to different services instead, set Map With Attribute to the attribute to route by using a placeholder. Then, map each value it can take to the service that should receive it.
For example, to route by a region attribute sent in the payload, set Map With Attribute to {{ region }}, then map US to one service and EU to another, and so on.
- Click Next to move on to the Authorization tab.
- Select the Default Service incidents should be sent to. To route incidents to different services instead, set Map With Attribute to the attribute to route by using a placeholder. Then, map each value it can take to the service that should receive it.
- Authorization (Optional)
- The Authorization tab allows a Bearer Token and an IP Allowlist be added if you would like to restrict who is able to send alerts to this integration. If you are unsure, this can be skipped.
- Once done, click Save.
- Copy the Integration Url that is issued for the integration. This will be used to set up the notification in Prometheus.
On Prometheus Server
- Go to your Prometheus server.
- Install the Alertmanager plugin if you have not already. The Alertmanager allows notifications to be sent out when alerts are raised by Prometheus. If your server is hosted on Ubuntu, then you can read this article on How to Install and Configure Prometheus Alert Manager on Ubuntu.
- We will need to set up a webhook receiver in the configuration file. Read about Alertmanager configuration files if you are unfamiliar with them.
- Give the receiver a name . For example, TaskCall-Notification-Channel . Then, paste the Integration Url you copied over from TaskCall in the webhooks url field.
receivers:
- name: <YOUR_RECEIVER_NAME>
webhook_configs:
- url: <INTEGRATION_URL>
- The default route in Prometheus to send all alerts which do not match any custom routes to the new TaskCall receiver can be set up as shown below:
route: group_by: ['alertname']
receiver: <YOUR_RECEIVER_NAME>
- You can also set up custom routes to send different types of alerts to different endpoints in TaskCall. For each endpoint you will need to set up a new integration to obtain a differnt Integration Url.
- Start the Alertmanager or restart it once you have set up the configuration file.
- Done! You should be all set up to receive alerts from Prometheus. You can send a test notification to yourself to test the set up with the following command:
curl -d '[{"labels": {"alertname": "TaskCall Prometheus Test Notification", "severity": "warning"}, "annotations": {"description": "This is a test alert"}}]' http://localhost:9093/api/v1/alerts
Notes
TaskCall tries to make the alert details as contextual as possible by looking for details from the payload that is sent to it. Some of the fields that TaskCall looks for include annotations > summary, annotations > description and labels > severity. Here is a snippet of what alert rules can look like:
- name: example
rules:
- alert: HighRequestLatency
expr: job:request_latency_seconds:mean5m{job="myjob"} > 0.5
for: 10m
labels:
severity: page
annotations:
summary: High request latency
description: The description that will be shown in the body.
Please follow the Prometheus Alerting Rules documentation to learn more.