Application Performance Monitoring (APM) - Importance, Metrics & Tools
The performance of an application can make or break a business. For companies that deliver products or services through software, even small disruptions can impact customer trust and revenue. Ensuring applications run smoothly has become essential for long-term success.
Application Performance Monitoring (APM) gathers data that ensure applications perform optimally. It enables the observation and analysis of an application’s health and performance. A well-functioning application provides a positive user experience.
APM gathers telemetry data from different processes to determine efficiency, current issues and potential issues in the system. It can help a company ascertain its ability to maintain uninterrupted business processes.
In this article, we will try to understand the:
- Importance of APM
- Key Components of APM
- Metrics Tracked by APM
- Use Cases of APM
- Difference between APM and Observability
- Best APM Tools
Why is Application Performance Monitoring Important for Modern Applications?
The performance of an application is tied to the growth and success of a business. Flawed applications or slow websites can drive your customers toward your competitors.
This is why the implementation of APM is vital. It helps identify and resolve performance bottlenecks that may arise due to system failures, inefficient codes, or even increased traffic.
Performance monitoring has three important aspects to it:
- Front-end monitoring - It helps to inspect the application from the user’s point of view as a part of the user experience.
- Back-end monitoring - It tracks the numerous services and elements that the application depends on (e.g., a vital database).
- Infrastructure monitoring - It helps ensure that the overall infrastructure is secure, well-configured and functional (The infrastructure can be local or cloud-based).
Through proactive monitoring, organizations can save unnecessary costs by avoiding application downtime and troubleshooting. This also helps maintain SLAs (Service Level Agreements) regarding the functioning of the application.
Source: Asper Brothers
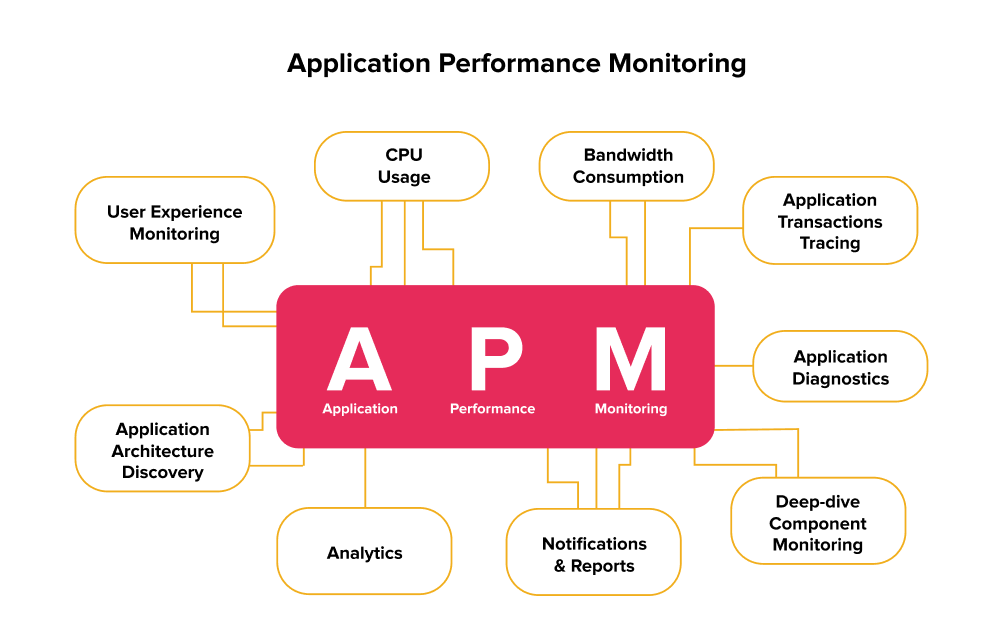
Key Components of Application Performance Monitoring (APM)
1. Runtime Application Architecture
The Runtime Application Architecture constitutes the hardware and software components of the application. APM monitors these components while the application is working and tracks the paths used by the various elements to communicate.
This helps programmers identify performance problems and the potential for future problems in any given area. So the programmers can then rectify those issues and ensure smooth functioning.
2. Application Mapping
Application Mapping provides a visual representation of an application's architecture and its components. It provides an overview of how different services and databases interact with each other.
When users interact with the application, APM maps the flow of data as it moves between different layers and services. This flow helps IT professionals understand the complexity of the system.
The visual map helps IT professionals detect the source of performance issues and the components affected by them.
3. Alerting Mechanism
The alerting mechanism is a critical component of Application Performance Monitoring. It is responsible for alerting IT teams when it detects performance issues or anomalies in the system.
Admins and IT teams set threshold values for certain important metrics. When these thresholds are crossed, the APM tool alerts the concerned team via emails or instant messages.
This mechanism is vital to proactively detect issues and resolve them before the application degrades or crashes. It also helps to reduce the MTTR (mean time to resolution) for all issues.
An ideal example is the alerting mechanism provided by TaskCall. It efficiently alerts the DevOps teams and provides various analytics to diagnose and resolve the issues.
4. Business Transactions
The Business Transactions component is also known as User-Defined Transaction Profiling. It is a diagnosis tool that helps identify the source and cause of an issue.
It examines specific user actions and recreates them to understand what leads to the performance problem. When paired with Component Monitoring, it acts as an effective troubleshooter.
5. Analytics and Reporting
This is the final component that uses all the data gathered in the above processes to assist in making insightful decisions. It helps determine a performance baseline for reference.
It also identifies possible areas of improvement or performance issues. The Analysis component is the conclusion of all the above processes that helps the organization keep the application functioning efficiently.
Core Metrics Tracked by Application Performance Monitoring Tools
APM tracks many different metrics. This data creates a comprehensive view of the application and its performance. Some important metrics that should be tracked are:
- CPU usage: CPU usage helps determine if the application is using the server’s processing power efficiently or not. It notifies IT professionals of instances when the server gets overburdened.
- Memory usage: Memory usage tracks the amount of memory required by different functions of the application. Performance issues may occur from over or under-utilization of memory.
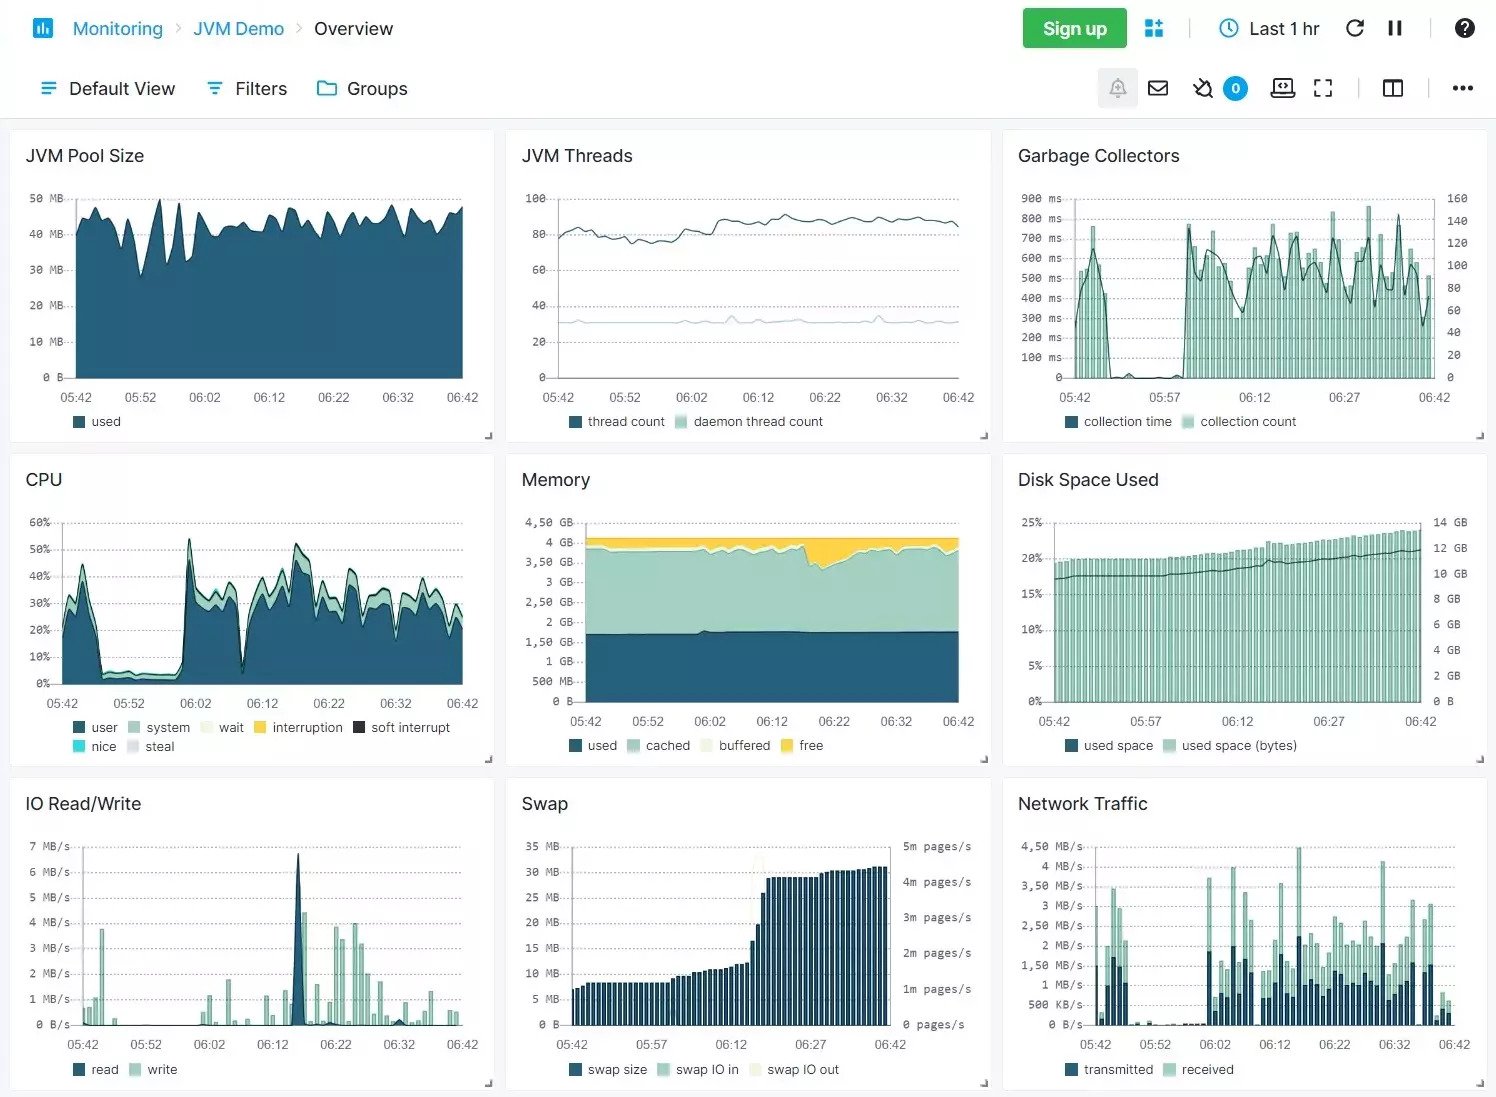
Source: Sematext
- Response times: Response time is the amount of time taken to return a request from an end user. For example, it could be the time taken to load a user’s profile. Longer response times may create performance issues.
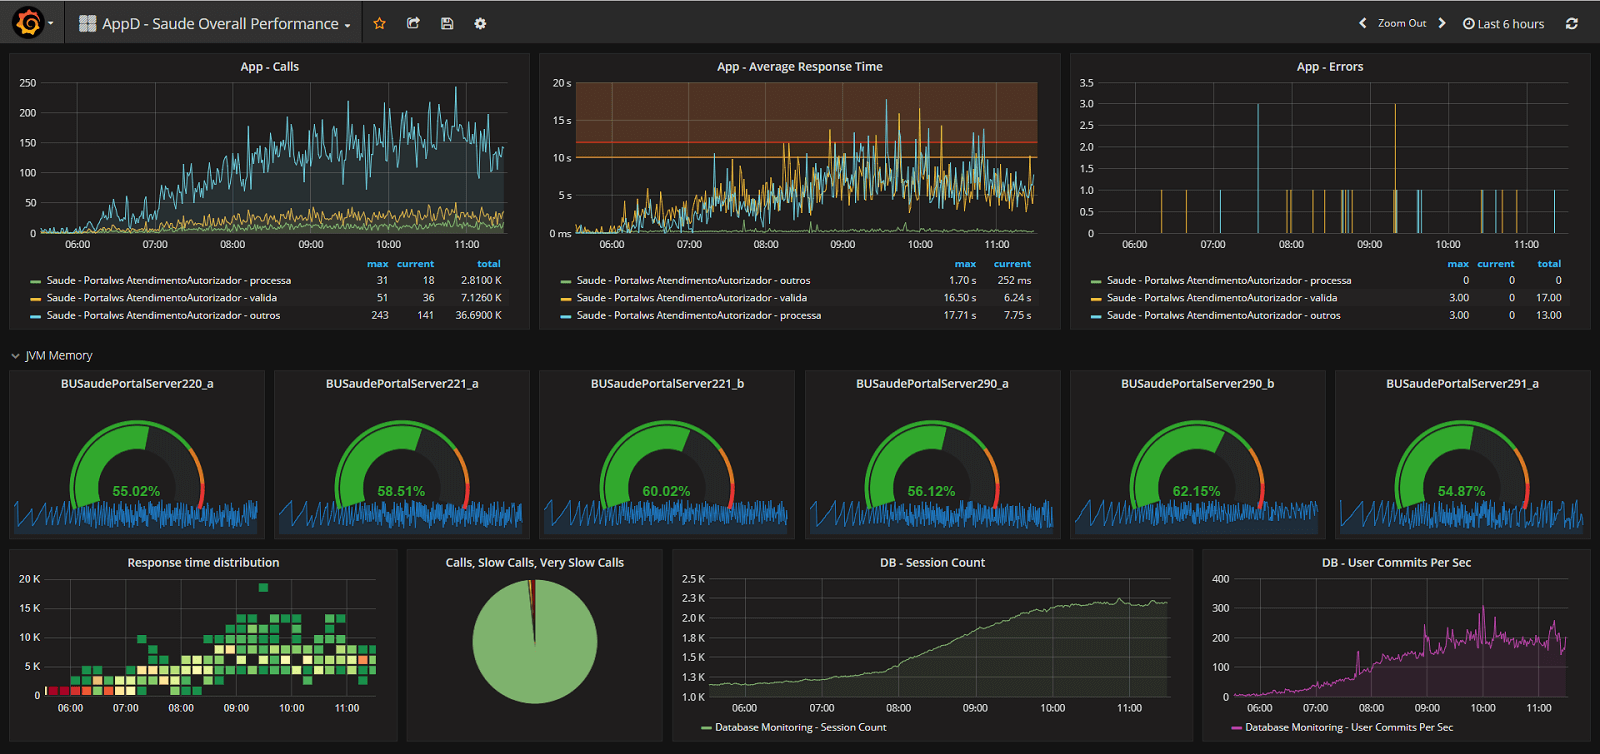
Source: Grafana
- Error rates: This is the percentage of failed requests or errors that occurred during a transaction. It helps us understand how the application fails at the software level.
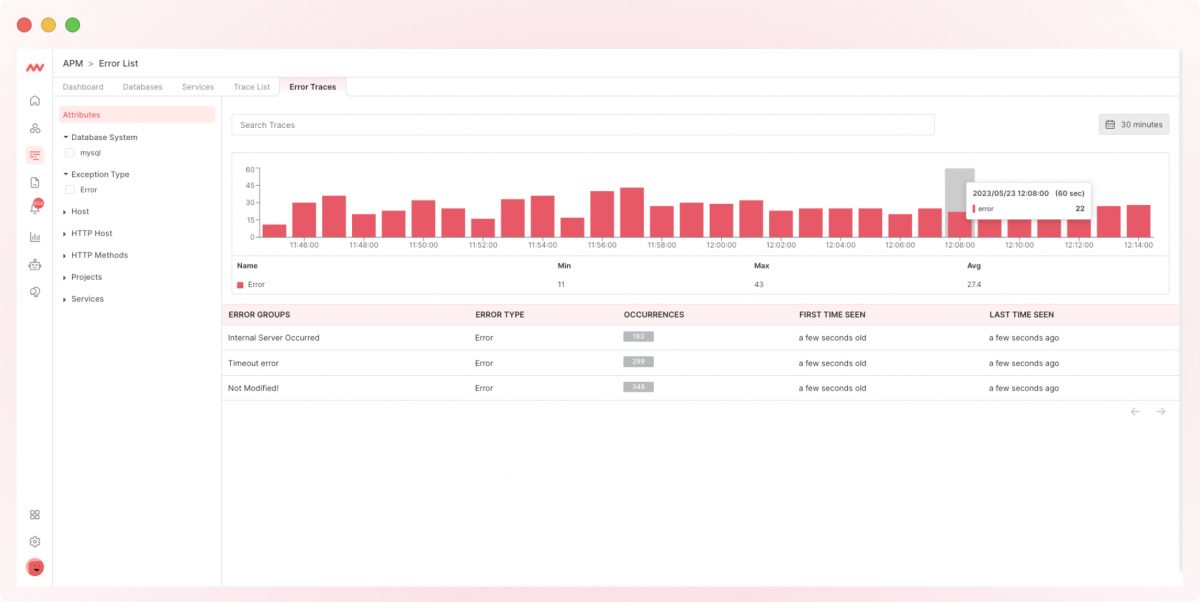
Source: Middleware
- Transaction tracing: Transaction tracing gives an overview of any specific transaction. It gathers data from initiation to the end of a transaction. It helps IT professionals monitor each transaction and its functioning.
- Network latency: Network latency is a measure of the time that data travel takes between a user and the application server. A higher latency may lead to a slow-performing application. Network latency can also affect performance in other applications and systems.
- Throughput/Request rates: Throughput is the total number of requests an application can process. It also helps understand the application’s capacity to handle user traffic.
- Application availability and uptime: Uptime is the amount of time an application is functioning and available to its users. Some SLAs allow for very little downtime, so it is vital for organizations to monitor this metric.
Top Use Cases of APM in IT and DevOps
Let’s explore some examples of how Application Performance Monitoring tools can streamline application functioning.
Real User Monitoring (RUM)
Real user monitoring focuses on monitoring the actual experiences of users. User interactions with any app are used to establish a baseline for acceptable performance.
When user actions deviate from this baseline at a large scale, real user monitoring tools flag it as a potential bottleneck. APM then alerts the relevant teams to look into this issue.
Real user monitoring also helps identify trends in user behavior. These trends can be used to create a more user-friendly experience.
Source: Devopedia
Root Cause Analysis
Application Performance Monitoring tools are invaluable for identifying issues or errors that plague an application. These tools can help perform a root cause analysis. This analysis gives insights into the source and nature of the problem.
APM solutions can collect metrics, logs, and traces to detect the source of the problem. This helps developers determine what needs to be fixed.
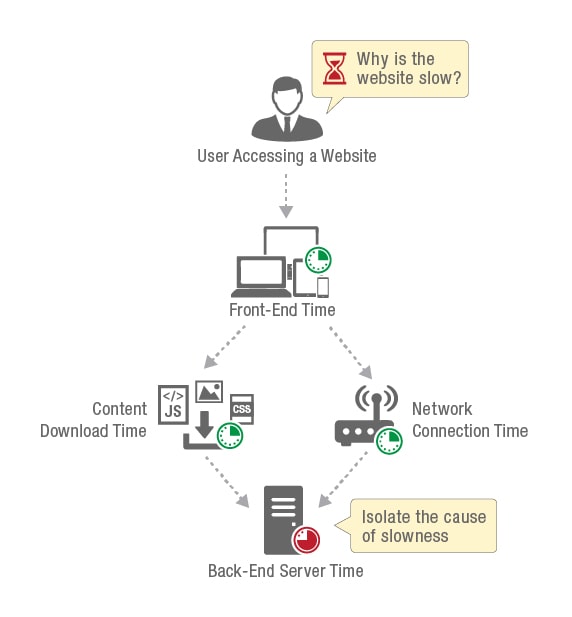
For example, if a website experiences slow page loading, a root cause analysis through APM tools can help determine if it was due to an inefficient database query, a bad code segment, or external service downtime.
Component Monitoring
Component Monitoring keeps track of all elements of the application ecosystem. Software metrics like memory usage, error rates, and CPU utilization help ensure the proper functioning of the application. While infrastructure monitoring (servers and network components) helps keep an eye on the hardware components that are required to run the application.
Infrastructure Monitoring
Infrastructure Monitoring is a part of the APM toolset that gathers data from hardware components of the application ecosystem. These components include servers, containers, databases, virtual machines, and other back-end systems.
This collected data helps IT professionals understand the health of the system and carry out maintenance when required. It also helps them determine performance problems and find their source.
Capacity Planning
Capacity Planning is vital for optimal resource utilization. APM tools play a crucial role in capacity planning by providing the necessary data on resource consumption.
Historical performance metrics give IT professionals an overview of how much resource is being requested by the application components. It also helps them understand trends to predict high resource consumption periods.
For example, APM tools could identify certain periods of the day when resource consumption is higher than normal. This could be due to an increase in user traffic. Organizations can then allocate additional resources during those peak hours to ensure optimal performance and avoid downtime.
SLA Monitoring
Service Level Agreements are legal documents that bind the IT service provider and a client. They state a mutually agreed upon set of conditions and expectations regarding the application's performance.
They also highlight what would constitute as falling below agreed-upon standards (like application downtime). So, maintaining those standards becomes crucial. This is done with the help of APM tools that ensure that the application functions optimally at all times.
How Does APM Differ from Observability?
While APM and observability share the common goal of ensuring system reliability, they are not the same. APM focuses on tracking and analyzing application performance metrics, whereas observability provides a broader, system-wide view using logs, metrics, and traces. Understanding the difference helps teams choose the right approach for performance optimization and troubleshooting.
Monitoring Focus
APM primarily concentrates on monitoring application performance metrics like response time, error rate, and database performance. It provides IT professionals with an understanding of the application’s internal workings.
Observability encompasses the entire system. It monitors apps, infrastructure, and all external dependencies. Its purpose is to provide a holistic view of the entire system’s functions. It also helps bring together different application components (programmed in various languages) to aid in a singular purpose.
Components
APM is quite developer-centric. It focuses on the application layer and offers insights into the code, server, and database interactions.
Observability mainly deals with logs, metrics, and traces from various components (like servers, networks, applications, etc.).
Utilization in DevOps and SRE
APM aids in troubleshooting and optimizing application performance. It can efficiently determine performance issues and their causes.
Observability is more focused on detecting complex issues and improving system-wide performance. It swaps traditional monitoring tools for instruments that collect performance and contextual data non-stop.
Choosing the Right APM Tool for Your Business
There are many Application Performance Monitoring tools available in the market. You should choose the one that serves your requirements, based on the programming languages serviced and the features offered.
Here are some of the most popular APM tools used by IT firms:
Application Performance Monitoring is a key practice for modern businesses. It ensures that their applications deliver an optimal and seamless experience to users. Its tracking capabilities make it an essential troubleshooting tool.
More businesses should start investing in APM to stay competitive. APM’s ability to deliver exceptional user experiences makes it essential for fostering customer loyalty and driving growth.
Final Thoughts on Application Performance Monitoring
Application Performance Monitoring (APM) is no longer optional; it’s a necessity for businesses that rely on software to deliver products and services. By tracking critical metrics like response times, error rates, and uptime, APM empowers teams to detect problems early, optimize performance, and ensure seamless user experiences. Beyond troubleshooting, it strengthens reliability, supports SLA compliance, and helps organizations scale with confidence. Choosing the right APM tool can be the difference between frustrated users and a competitive, high-performing business.
Keep your applications running smoothly with TaskCall. Along with advanced APM tools integrations, our platform helps you with incident management, automates alerts and incident response before issues affect users. Try TaskCall today and ensure reliability at every step.
You may also like...
One of the core pieces of maintaining a sophisticated operation is delegation of responsibilities. If one individual ends up doing bulk of the work then the whole process will be slowed down. Their individual efficiency will not hold up to the standard either.
Incident metrics are useful numerical insights about how fast technical issues are handled, how often they occur and how they impact your infrastructure and services. Mean time to acknowledge (MTTA) and mean time to resolve (MTTR) are good places to start, but the scope of evaluation is far bigger.