Top 7 Incident Metrics for DevOps
The core of incident response lies in reducing the time to resolve incidents. The faster they are dealt with, the lower will be the impact on your users and their usage of your service. Data suggests that $141,628 is lost per major incident on average and 5 such incidents occur a year. Of course the numbers vary based on the size of the company, but the bigger the company, the higher is the loss. It was estimated by outside sources that the 6 hour global outage of Facebook in 2019 cost the firm $90 million. Needless to say, incident metrics are vital to understanding the impact on your business.
The initial focus should stay on introducing a fix, but the process must not stop there. Closer attention should be paid to incident metrics afterwards to understand how efficiently it was handled and identify error prone components to improve efficiency and system resilience. Mean time to acknowledge (MTTA) and mean time to resolve (MTTR) are good places to start, but the scope of evaluation is far bigger. We will explore some of the important metrics here.
What are Incident Metrics?
Incident metrics are useful numerical insights about how fast technical issues are handled, how often they occur and how they impact your infrastructure and services. They help identify vulnerabilities in your platform and highlight areas of improvement in your team.
Key Incident Metrics
The metrics of interest may vary from one team to another, but teams usually look at several in their evaluation. We have listed the top 7 incident metrics metrics here for DevOps and explained what they signify.
Mean Time to Acknowledge (MTTA)
It is the average time taken to notice and start addressing an incident after it occurs. If your web server overloads and fails at 03:53 pm and the on-call responder acknowledges it at 03:58 pm, then the time to acknowledge is 5 minutes. The mean spans across multiple such events.
By looking at the MTTA firms are able to tell how responsive their on-call responders are. MTTA higher than a couple of minutes is usually deemed negative. It could mean that on-call responders are not taking their roles as seriously as they should, resulting in a loss of precious time. Responders must always start looking into the cause of the problem as soon as it starts. Lower MTTA is indicative of an alert and fortified team.
Mean Time to Resolve (MTTR)
It is the average time taken to resolve an incident. It is calculated by summing up the time spent from start to fix of all incidents over a period of time and dividing it by the number of incidents. It is the single most important metric that all firms closely monitor. It concisely shows how much time is lost by DevOps in handling errors outside of their work.
Continuing on with the above example, after acknowledging the failure of the web server if the on-call responder takes a further 23 minutes to resolve the problem, then the MTTR will be 28 minutes. Since the time to resolve also includes the time to acknowledge, MTTR must always be higher than MTTA. If the MTTR is equal to the MTTA then it means that on-call personnel are resolving instances directly without acknowledging them. This goes against best practices. If they resolve without actually fixing the issue, then they are extremely likely to lose track of it if other errors start occurring. If they start working on the issue without taking ownership then it will escalate to their secondary support unnecessarily and add more interruptions in the workflow.
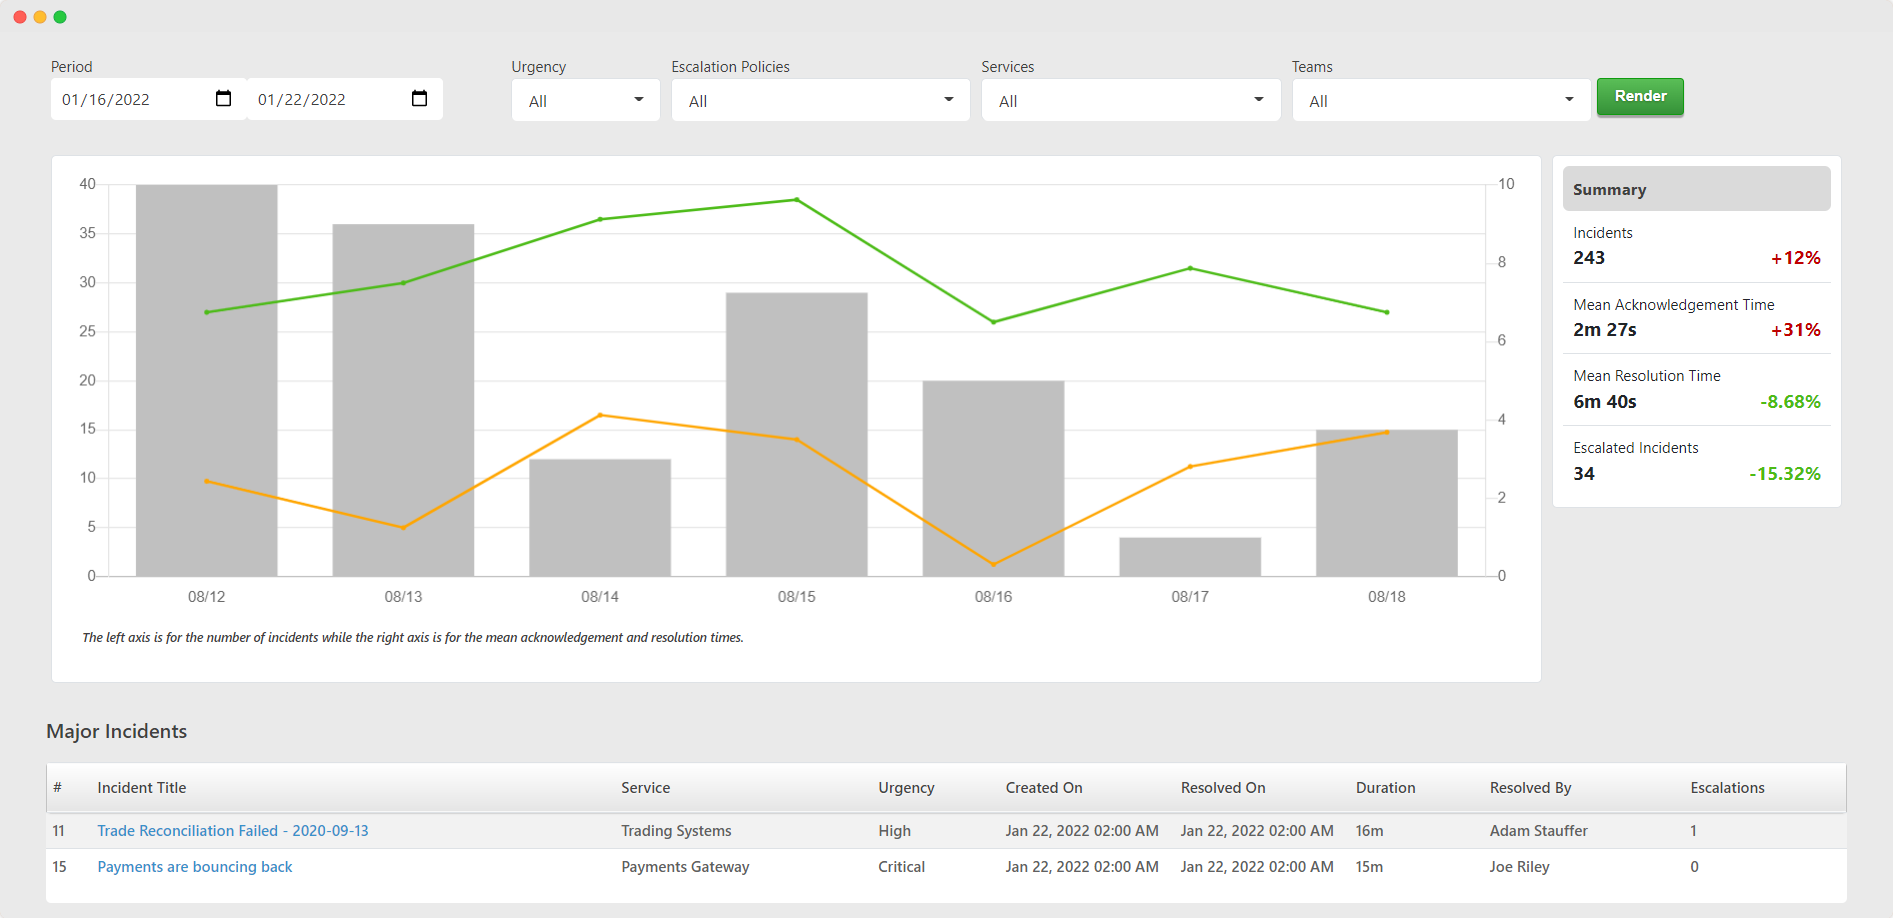
A snapshot of the incident analytics offered by TaskCall. It highlights the MTTA, MTTR, the number of incidents and how the figures changed over time. The results can be filtered by service, team and tags to narrow down the scope of analysis.
Incident Count
The number of incidents that have occurred over a period of time is a starting point for all companies. The higher the count, the more error prone your system must be. Although some may think having none at all would be the benchmark, realistically that is hardly the case. For bigger companies it is almost unheard of to go a single day without an incident. All occurrences do not impact customers. Most are internal and are contained before production deployment, but they do still occur.
Reducing the number of error prone events is always desirable, but the acceptable average may vary from team to team. The target and the period to consider for the calculation (weekly, monthly) have to be set by the team managers based on their respective goals. Companies in the early stage may see more interruptions day to day as opposed to those that are more mature. It is all relative.
Major Incidents
Not all issues are the same. Some can have a system wide impact while others can be confined to a small segment. Events that have a widespread affect are likely to be more important than others. It will be vital to track them separately. A DevOps team that sees 50 incidents monthly where 40 are major is probably not running their tests before deployment as diligently as another team with the same number of instances, but only 5 of which are deemed as major events. Monitoring and understanding the severity of system issues can help team leaders direct resources in right areas. They can be aided by incident management tools to evaluate better and faster without having to do the grunt work.
Loudest Services
A service is a technical component of your system or a unit of your infrastructure – e.g. load balancers, APIs, servers, transaction gateways, etc. The aggregate number of incidents over time, daily or weekly gives you an overview of your system, but looking into application specific errors allows you to go into more depth. Some services may be faultier than others. If they can be identified distinctly then resources and time can be allocated more objectively to improve performance. Followed by this, unnecessary interruptions and noise will naturally go down so DevOps can focus on their day to day tasks more.
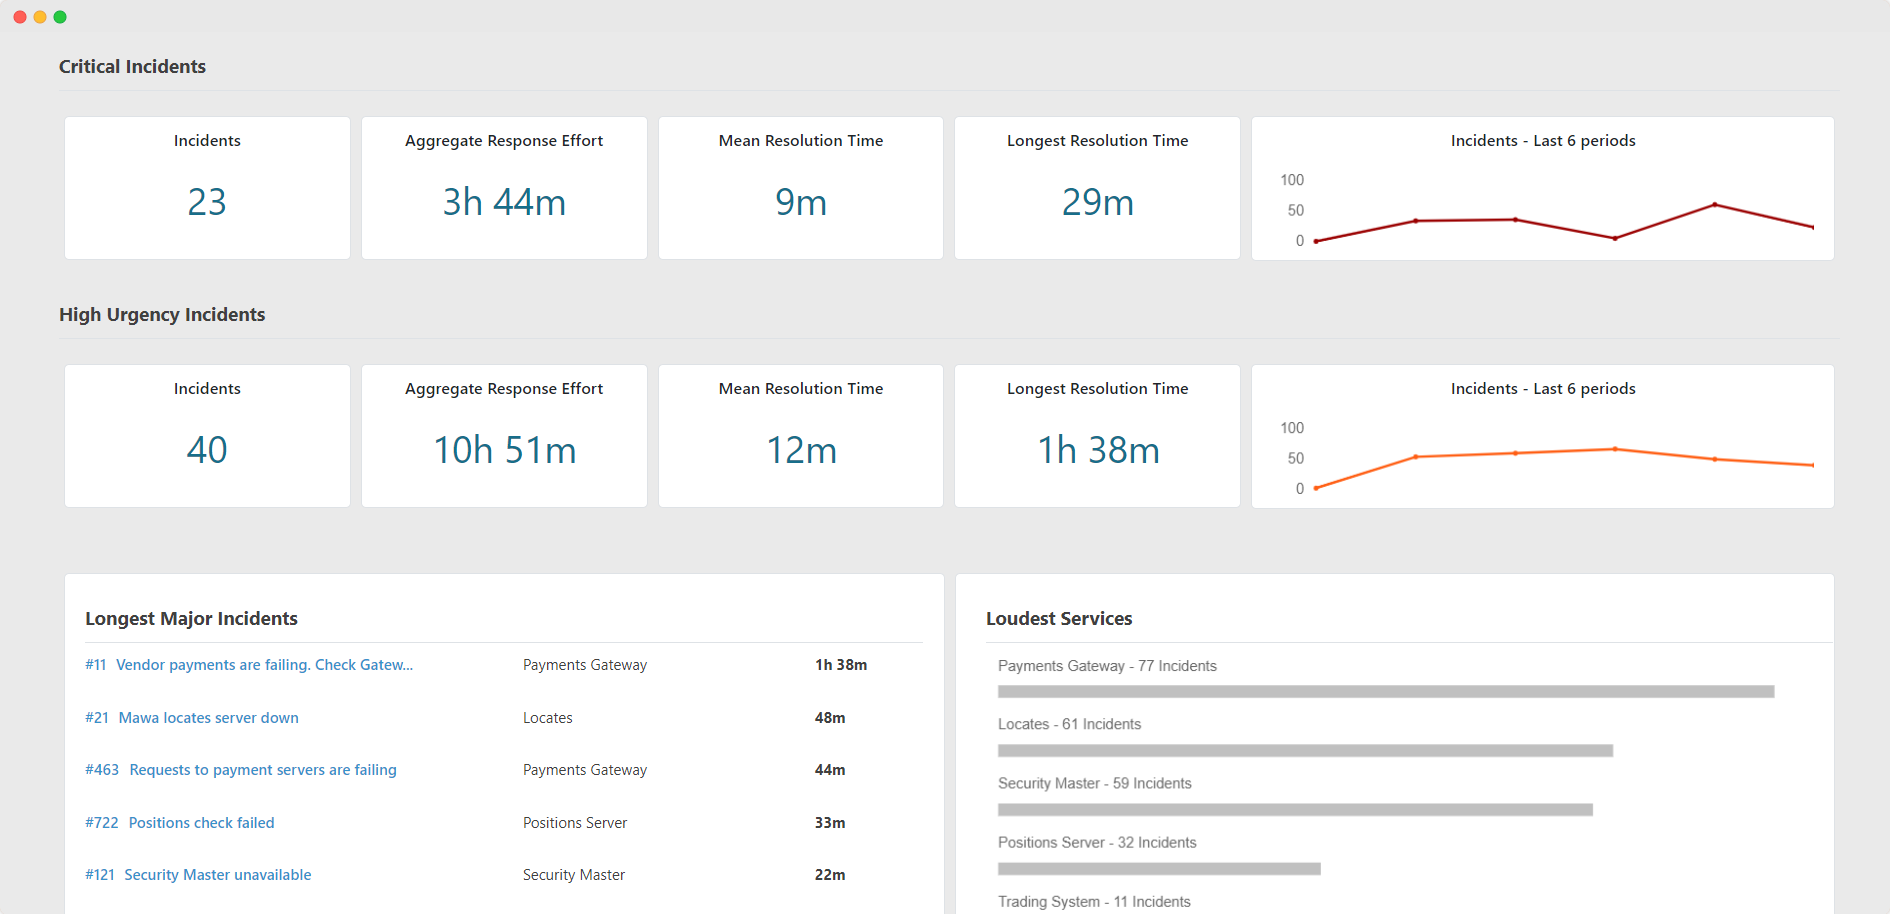
A snapshot of service analytics provided by TaskCall. It gives organizations a focused view of their system resilience.
Business Outages
Similar to the distinction between low severity errors and major errors, distinctions should also be made between internal and client facing errors. If a technical failure is restricted to internal systems it is far less concerning than when it proliferates into client facing end services because it directly affects the firms revenue stream like the AWS outage of July 8, 2022. AWS US eastern data centers faced a power outage and disrupted the services of major enterprise systems like Webex and Okta that rely on AWS. It is rare for big companies to have long outages, but when there is one, the loss of revenue can easily be in the millions. Saving every minute is of utmost importance.
For smaller companies, minor service downtime will not only render losses, but can also result in user dissatisfaction and a higher churn rate (percentage of customers who leave your service over a period of time). Distinguishing business impacting incidents are crucial to evolving in the digital age. These metrics are not easy to trace manually, however. Fortifying your operations with an incident tracking and management tool can make all the difference.
Costliest Incidents
This ties in closely with business outages. It goes deeper into isolating the system failures that cost firms the most in lost revenue. Calculating incident downtime gives a quantitative perspective into the impact, but identifying their root cause allows recurrences to be halted. Lessons learnt from an event must always manifest through improvements to avoid similar situations in the future.
The cost is not merely a revenue loss. The cost of labor that went in towards resolving the matter whether it is a direct cost or an opportunity cost must also be accounted for. In some cases it may also be relevant to look at how many existing and potential clients were lost during the outage. Although the calculation is not straightforward as there are some predictive variables, a fair estimate can be obtained if data is recorded through digital incident management.
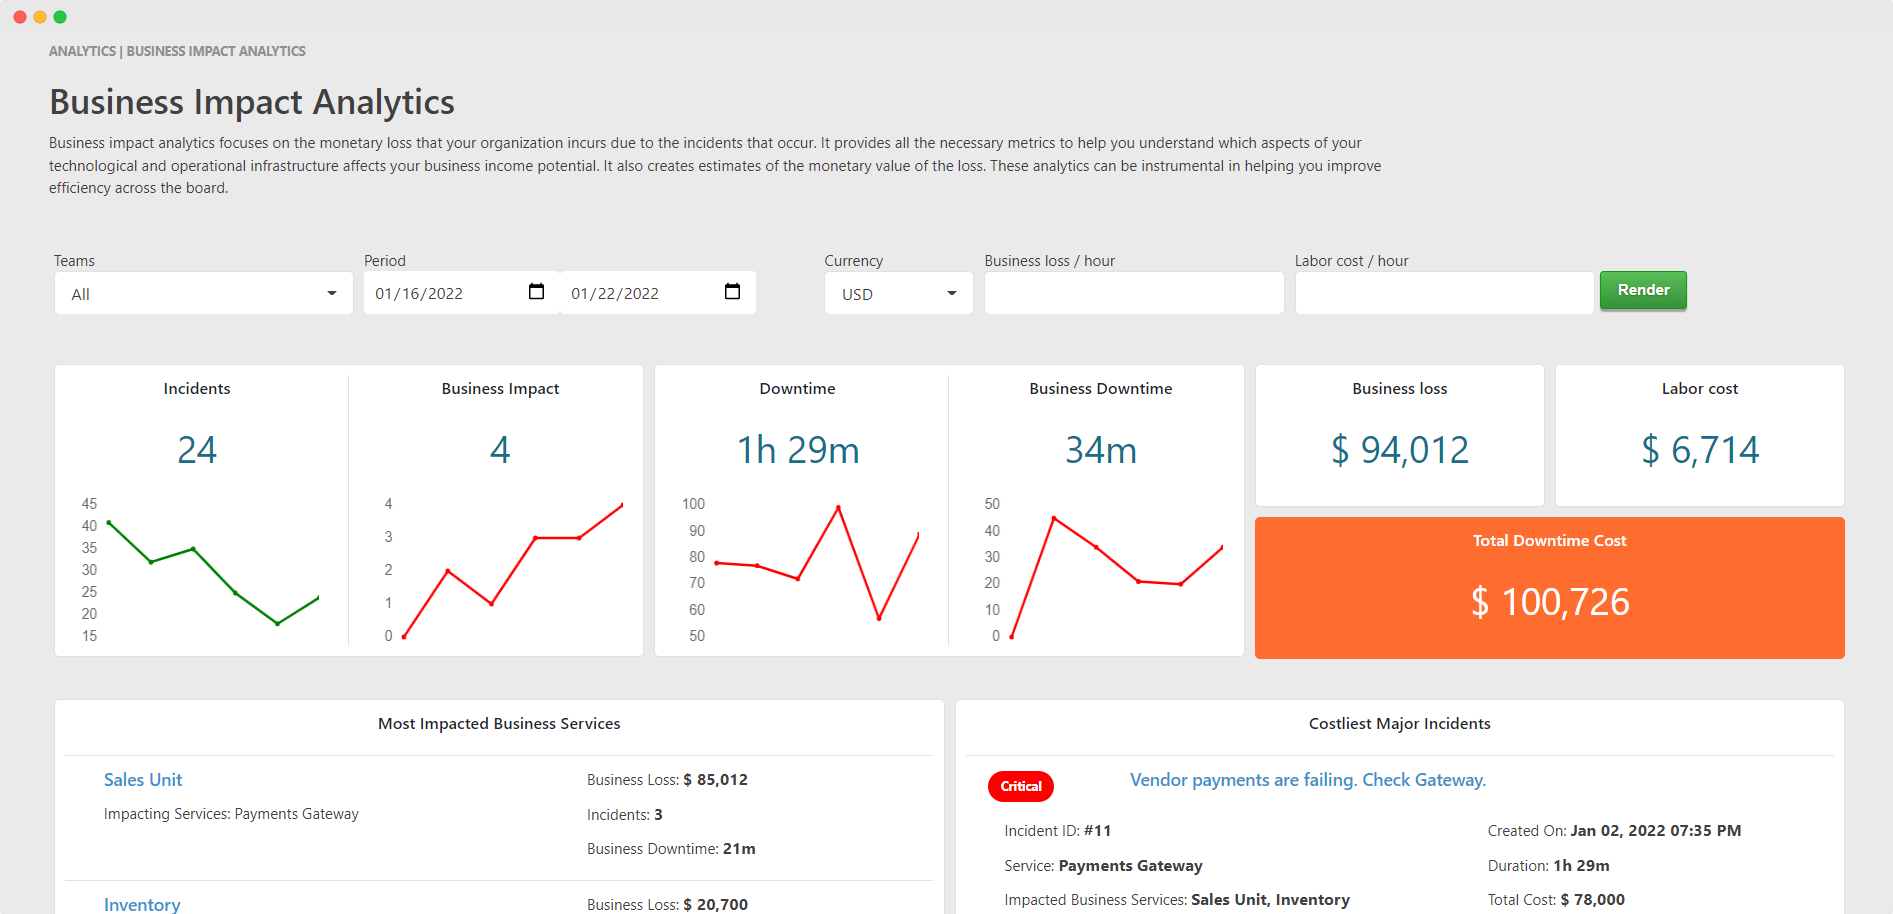
Business impact analytics provided by TaskCall allows clients to easily gain an understanding of the cost of downtimes and helps then identify the culpable incidents so they can be rectified and avoided in the futures.
As much as it helps to understand what your incident metrics say about your operations, it is also important to track the progression of improvements implemented overtime. Without seeing how your incidents have gone down (or up) over a period of time and how they impact your operations, it will not be possible to truly know whether changes made are rendering the desired outcome. Periodic review, whether it is monthly or weekly would fall right into the best practices of modern DevOps teams.
Each of the metrics we have discussed here must be looked at objectively for the period in concern and be compared with other periods in the past to see how your team and platform are evolving. Recognizing patterns in the numbers can be crucial towards your growth. While IT leaders need to see through with the development of technical services and the infrastructure, they must do so with clear context of existing problems.
Making business decisions without data is like throwing darts with a blindfold on. Incident reporting systems can present the metrics and identify patterns that can help guide teams forward. On top of day to day work, manually tracking incident data is a monumental task. Let digitization and automation take care of your incident response and management while you only focus on what matters.
You may also like...
Incident response is the process of addressing technical issues that occur in a company. It could be business application errors, database issues, untested deployment releases, maintenance issues or cyber-security attacks. Automation allows such incidents to be resolved fast and save losses.
One of the core pieces of maintaining a sophisticated operation is delegation of responsibilities. If one individual ends up doing bulk of the work then the whole process will be slowed down. Their individual efficiency will not hold up to the standard either.